Hazardous Profits
Jack and Charles Colbert were no ordinary businessmen. The brothers were among the most famous and notorious hazardous waste traders in the history of the United States. Their business model appeared to be as simple as it was lucrative. Since the mid-1970s, the Colbert brothers bought industrial waste and surplus chemicals from chemical companies in the United States for very low prices—or even got them for free—and stored them in a network of warehouses across the country. They specialized in chemical products that had been banned in the US for sale. The Colberts bought certain poisons, unregistered pesticides, or even slightly contaminated toothpaste, and exported them to other countries instead of disposing them properly as hazardous waste. Many countries in the Global South had less stringent regulations in place, which oftentimes offered the Colbert brothers the opportunity to carry out their international trade deals with such substances legally.
Morally questionable waste deals
In what they called the “surplus chemical business,” the Colbert brothers were able to “recycle” chemicals banned in the United States and send them, for instance, to Zimbabwe—where they were still legal for use in industrial production or agriculture. Although their chemical “products” were harmful and toxic, the Colbert brothers argued in favor of their business. They claimed that by exporting these materials to where they were needed and used, the world could avoid producing more of them. Additionally, they framed their waste imports as part of a development scheme, as the chemicals would be used in growing economies, thus creating jobs for people in need. US companies in turn were eager to get rid of their toxic, flammable, or carcinogenic waste through the Colberts’ trade scheme, which also freed the companies from the responsibility of dealing with the waste any further. The “surplus chemical business” offered profits and advantages for everyone involved, or so it seemed. Often such business interests were the driving force behind the global waste trade.
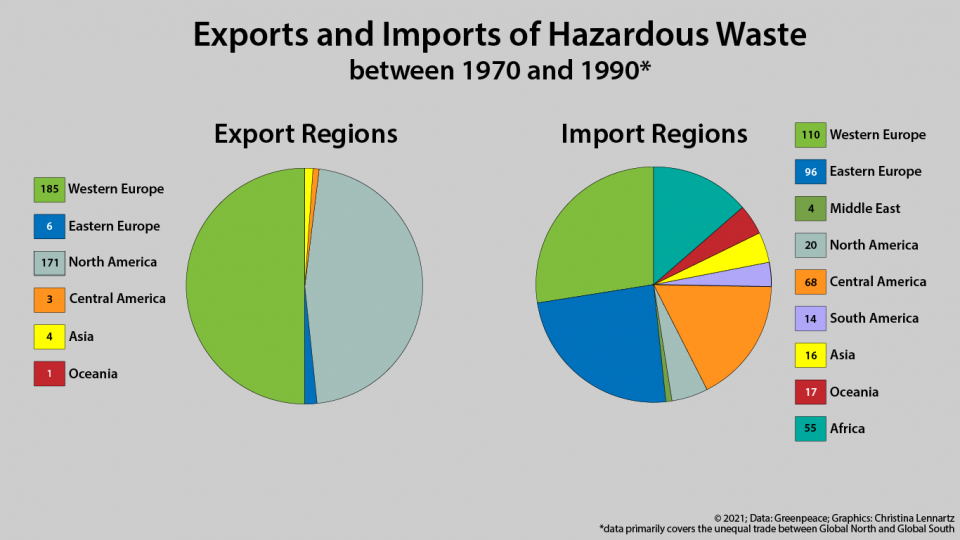
The Greenpeace Inventory documented 34 exporting and 106 importing counties in total. The graphic illustrates the total frequency of trades. The number of exports and imports sum up unequally, which is attributed to incompleteness in the databank. The biggest exporters were the United States of America, Western Germany, and the European Economic Community (collaborated exports by several European Countries). What becomes apparent is that most exports come from North America and Western Europe, whereas imports are much more dispersed. Many of the US exports, for example, went to Central and South America or Western Europe, particularly to its occupation zone in Western Germany. Western Europe dealt with most of its waste by shipping it to Eastern Europe, particularly to Poland and East Germany, where regulations on waste disposal were not as strict. What becomes evident is that most trade happened in the Northern Hemisphere between the 1970s and 1990s. The trending trade route was not necessarily from the Global North to the Global South but from the United States, as reigning power in the West, to Europe, and from Western Europe to Eastern Europe. Only in the late 1980s did the Global South emerge as a relevant destination for importing waste.
The Greenpeace Inventory documented 34 exporting and 106 importing counties in total. The graphic illustrates the total frequency of trades. The number of exports and imports sum up unequally, which is attributed to incompleteness in the databank. The biggest exporters were the United States of America, Western Germany, and the European Economic Community (collaborated exports by several European Countries). What becomes apparent is that most exports come from North America and Western Europe, whereas imports are much more dispersed. Many of the US exports, for example, went to Central and South America or Western Europe, particularly to its occupation zone in Western Germany. Western Europe dealt with most of its waste by shipping it to Eastern Europe, particularly to Poland and East Germany, where regulations on waste disposal were not as strict. What becomes evident is that most trade happened in the Northern Hemisphere between the 1970s and 1990s. The trending trade route was not necessarily from the Global North to the Global South but from the United States, as reigning power in the West, to Europe, and from Western Europe to Eastern Europe. Only in the late 1980s did the Global South emerge as a relevant destination for importing waste.
Graph by Christina Lennartz, 2021.
2021 Hazardous Travels Research Group.
 This work is licensed under a Creative Commons Attribution-NonCommercial-NoDerivatives 4.0 International License.

Many exports from Europe were actually a combined effort of multiple Western European countries that collaborated for a trade scheme. Additionally, trades were also executed by the European Economic Community (EEC), which was founded in 1957. The biggest European exporter was West Germany, who exported most of their waste to Poland and East Germany, as well as France. France was not documented as a big exporter of waste (only one listed export) but a large importer of waste (26 imports). Switzerland, on the other hand, was a very active exporter of waste, despite geographically being a landlocked country and relatively small in size. This could be explained by the fact that Switzerland is headquarters to many multinational corporations as well as many notable pharmaceutical and chemical companies. The Greenpeace Inventory listed East Germany as the only European exporter that was part of the Soviet Block. It exported its radioactive waste to Poland and the Soviet Union.
Many exports from Europe were actually a combined effort of multiple Western European countries that collaborated for a trade scheme. Additionally, trades were also executed by the European Economic Community (EEC), which was founded in 1957. The biggest European exporter was West Germany, who exported most of their waste to Poland and East Germany, as well as France. France was not documented as a big exporter of waste (only one listed export) but a large importer of waste (26 imports). Switzerland, on the other hand, was a very active exporter of waste, despite geographically being a landlocked country and relatively small in size. This could be explained by the fact that Switzerland is headquarters to many multinational corporations as well as many notable pharmaceutical and chemical companies. The Greenpeace Inventory listed East Germany as the only European exporter that was part of the Soviet Block. It exported its radioactive waste to Poland and the Soviet Union.
Graph by Christina Lennartz, 2021.
2021 Hazardous Travels Research Group.
 This work is licensed under a Creative Commons Attribution-NonCommercial-NoDerivatives 4.0 International License.
The deal with Zimbabwe was a case in point and ended up sending the Colbert brothers to jail. In 1983, they bought two types of surplus chemicals from an Ohio-based company for 60 cents a gallon and then for as much as $2.60 per gallon proceeded to sell them for use in machinery cleaning to a Zimbabwean company, which in turn paid for the chemicals through a loan given by US foreign aid. To increase their profit, the Colbert brothers had also watered-down the chemicals before shipping them off. What brought the Colbert brothers down after about 15 years in the business was this kind of fraud being discovered—not moral or environmental concerns about dealing recklessly with toxic chemicals.
The Colbert brothers were not the only ones involved in such schemes that made use of the ill-defined nature of hazardous waste. Yet, through their conviction they became the most visible. By nature, the global market in hazardous substances operated in an opaque sphere, making it difficult to actually track down its actors and their trade schemes. Lacking a global definition, numbers tracking waste produced let alone traded were hard to ascertain. Additionally, institutions to monitor the trade were only slowly established and often limited by their number of staff. When it comes to the number of trading schemes that existed prior to the 1990s, we would still be making more of an educated guess if it had not been for Greenpeace.
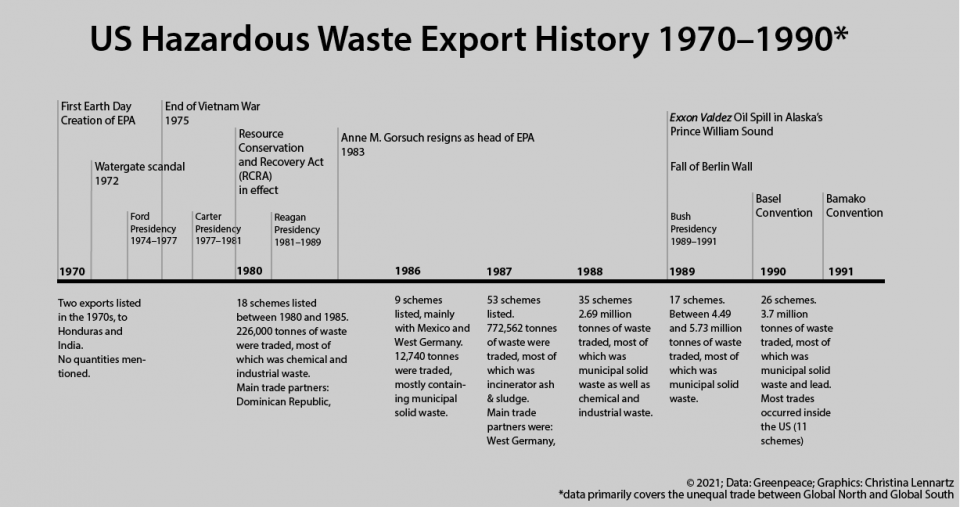
The United States of America are and were a global player when it comes to global hazardous waste trade, having the most documented trades (172 exports) in the Greenpeace Inventory. Most US exports occurred in 1987 (53 exports), whereas the biggest quantity of waste was exported in 1989 (4,5-5,6 million tons).
The United States of America are and were a global player when it comes to global hazardous waste trade, having the most documented trades (172 exports) in the Greenpeace Inventory. Most US exports occurred in 1987 (53 exports), whereas the biggest quantity of waste was exported in 1989 (4,5-5,6 million tons).
Graph by Christina Lennartz, 2021.
2021 Hazardous Travels Research Group.
 This work is licensed under a Creative Commons Attribution-NonCommercial-NoDerivatives 4.0 International License.
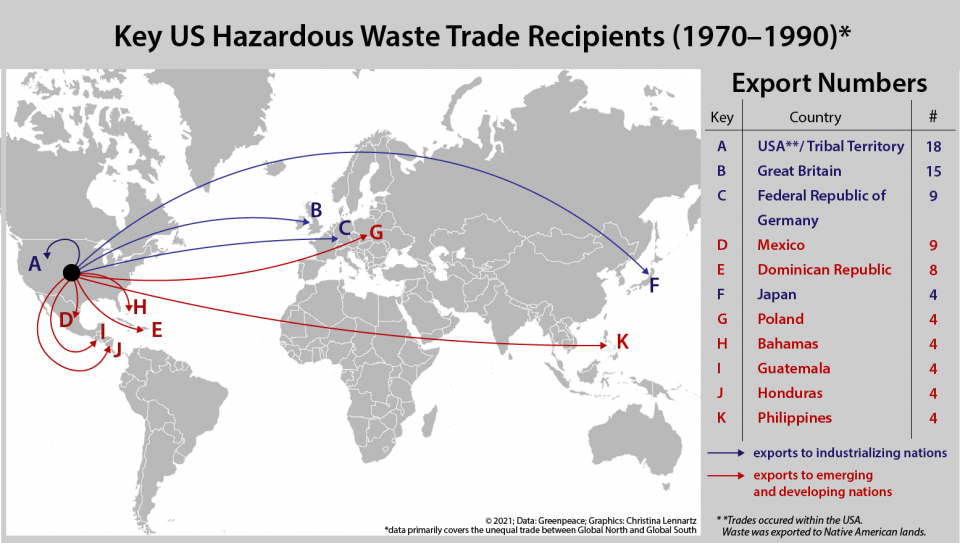
The United States’ most prominent trade partners were the United Kingdom, West Germany, and Mexico. Only in the mid to late 1980s did they begin exporting to Central and South America as well as Asia. Most trades however, occurred within the United States themselves. The documented “waste exports” were shipped to Native American Lands in Alaska, Arizona, California, Mississippi, and Nevada. Interestingly enough, Canada, one of the most relevant US trade partners, was mentioned to have imported waste from the US only three times. It has to be assumed that there were more than three exports of hazardous waste from the US, indicating a possible gap in the Greenpeace Inventory. Graph by Christina Lennartz, 2021.
The United States’ most prominent trade partners were the United Kingdom, West Germany, and Mexico. Only in the mid to late 1980s did they begin exporting to Central and South America as well as Asia. Most trades however, occurred within the United States themselves. The documented “waste exports” were shipped to Native American Lands in Alaska, Arizona, California, Mississippi, and Nevada. Interestingly enough, Canada, one of the most relevant US trade partners, was mentioned to have imported waste from the US only three times. It has to be assumed that there were more than three exports of hazardous waste from the US, indicating a possible gap in the Greenpeace Inventory. Graph by Christina Lennartz, 2021.
2021 Hazardous Travels Research Group.
 This work is licensed under a Creative Commons Attribution-NonCommercial-NoDerivatives 4.0 International License.
Tracking down the global waste trade
Greenpeace activists did the actual groundwork of rooting out a vast number of such hazardous waste deals between the 1970s and 1990s. With their Greenpeace Inventory published in 1990 and then updated in subsequent years, the NGO compiled an invaluable dataset on the international trade in hazardous wastes since the 1970s. This handbook alone documented about 400 individual trade deals, primarily between industrial countries and those then considered developing or emerging economies. And while it certainly supported Greenpeace’s campaign for a ban on exporting hazardous waste, the dataset poses some challenges in the effort to fully grasp the extent and economics behind such trade schemes. Surveying and documenting the waste trade was very difficult for Greenpeace in the pre-internet era. Many deals took place on the edge of legality, while other transactions could not be executed as intended, with the waste ending up at a different destination than originally planned. Sometimes based on hearsay, Greenpeace only had the information that an export was planned “to some African country.” A coherent, global trade data network with export and import licenses was not yet in place, so ships could easily come and go.

The late 1980s witnessed a peak both in the total number of trades as well as the quantity of hazardous waste traded globally.
The late 1980s witnessed a peak both in the total number of trades as well as the quantity of hazardous waste traded globally.
Graphs by Christina Lennartz, 2021.
2021 Hazardous Travels Research Group.
 This work is licensed under a Creative Commons Attribution-NonCommercial-NoDerivatives 4.0 International License.
By necessity, the data of the Greenpeace Inventory appeared unstructured and incomplete. For example, it contained the quantity of traded materials in all kinds of measures, ranging from tons, pounds, and gallons, to truck- and shiploads. And yet it is a treasure trove. The Inventory listed many companies, exporters, importers, and brokers involved, with a strong focus on exports from the United States and Europe. Finally, the dataset gives an impression of how many trade deals were successful, which deals failed, and the deals whose fate might remain forever unknown.
The Hazardous Travels research group at the Rachel Carson Center took up the challenge to get both a closer look at and a broader understanding of the global waste economy. With the goal of discovering possible trends and international waste streams, the research group visualized the data from the Greenpeace Inventory. This historical data is also essential to understanding the dynamics behind the current waste crises regarding plastics and electronic waste.
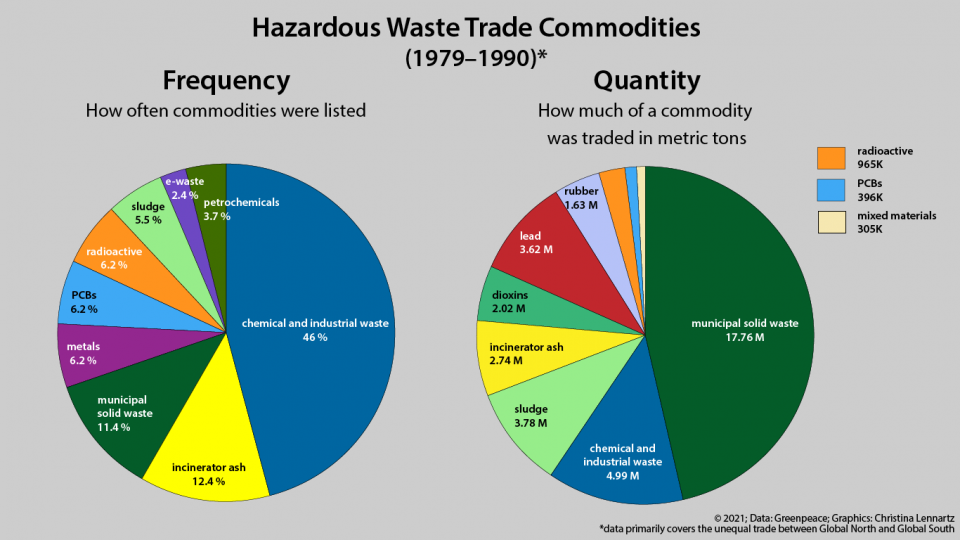
The different types of waste materials were condensed into overarching categories and were measured in tons. Traded materials were primarily chemical and industrial waste and municipal solid waste. Chemical and industrial waste contained soils and toxins, contaminated soils, and polluted water among others. Municipal solid waste contained a lot of household waste, garbage, paper, and a mixture of municipal and industrial waste. It can potentially be difficult to understand why municipal waste is seen as hazardous waste. Without proper disposal methods it can create similar harm to the environment. In addition, its composition often entails hazardous materials and chemicals, which can make it very difficult to recycle.
The different types of waste materials were condensed into overarching categories and were measured in tons. Traded materials were primarily chemical and industrial waste and municipal solid waste. Chemical and industrial waste contained soils and toxins, contaminated soils, and polluted water among others. Municipal solid waste contained a lot of household waste, garbage, paper, and a mixture of municipal and industrial waste. It can potentially be difficult to understand why municipal waste is seen as hazardous waste. Without proper disposal methods it can create similar harm to the environment. In addition, its composition often entails hazardous materials and chemicals, which can make it very difficult to recycle.
Graph by Christina Lennartz, 2021.
2021 Hazardous Travels Research Group.
 This work is licensed under a Creative Commons Attribution-NonCommercial-NoDerivatives 4.0 International License.
Now, for the first time, you can have a look at the results. Where did the waste actually go? What country is the most notorious exporter? The illustrations in this chapter offer you insights into the shady world of hazardous waste trades. But watch out, there will be some toxic revelations!


